Samples
Sample Power BI dashboards
The kind of reporting we build, across industries. Every company and number in these samples is fictional; the design choices, measures and layouts are the same ones we use on client work.
Dashboards
Built around the decisions they support
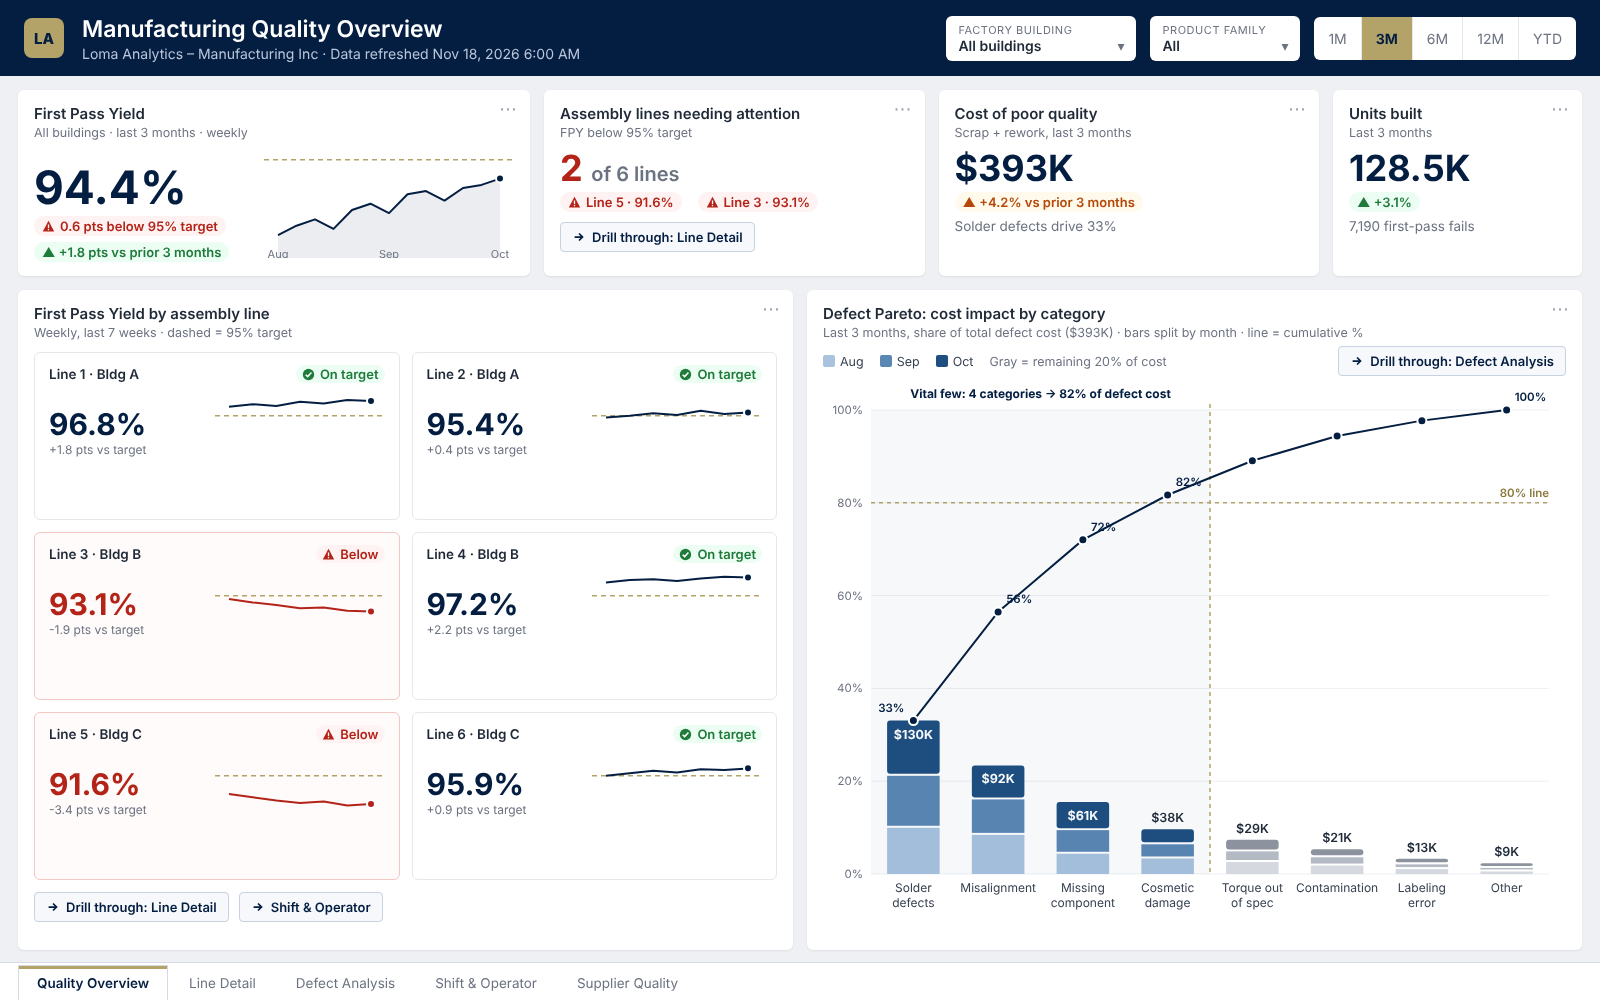
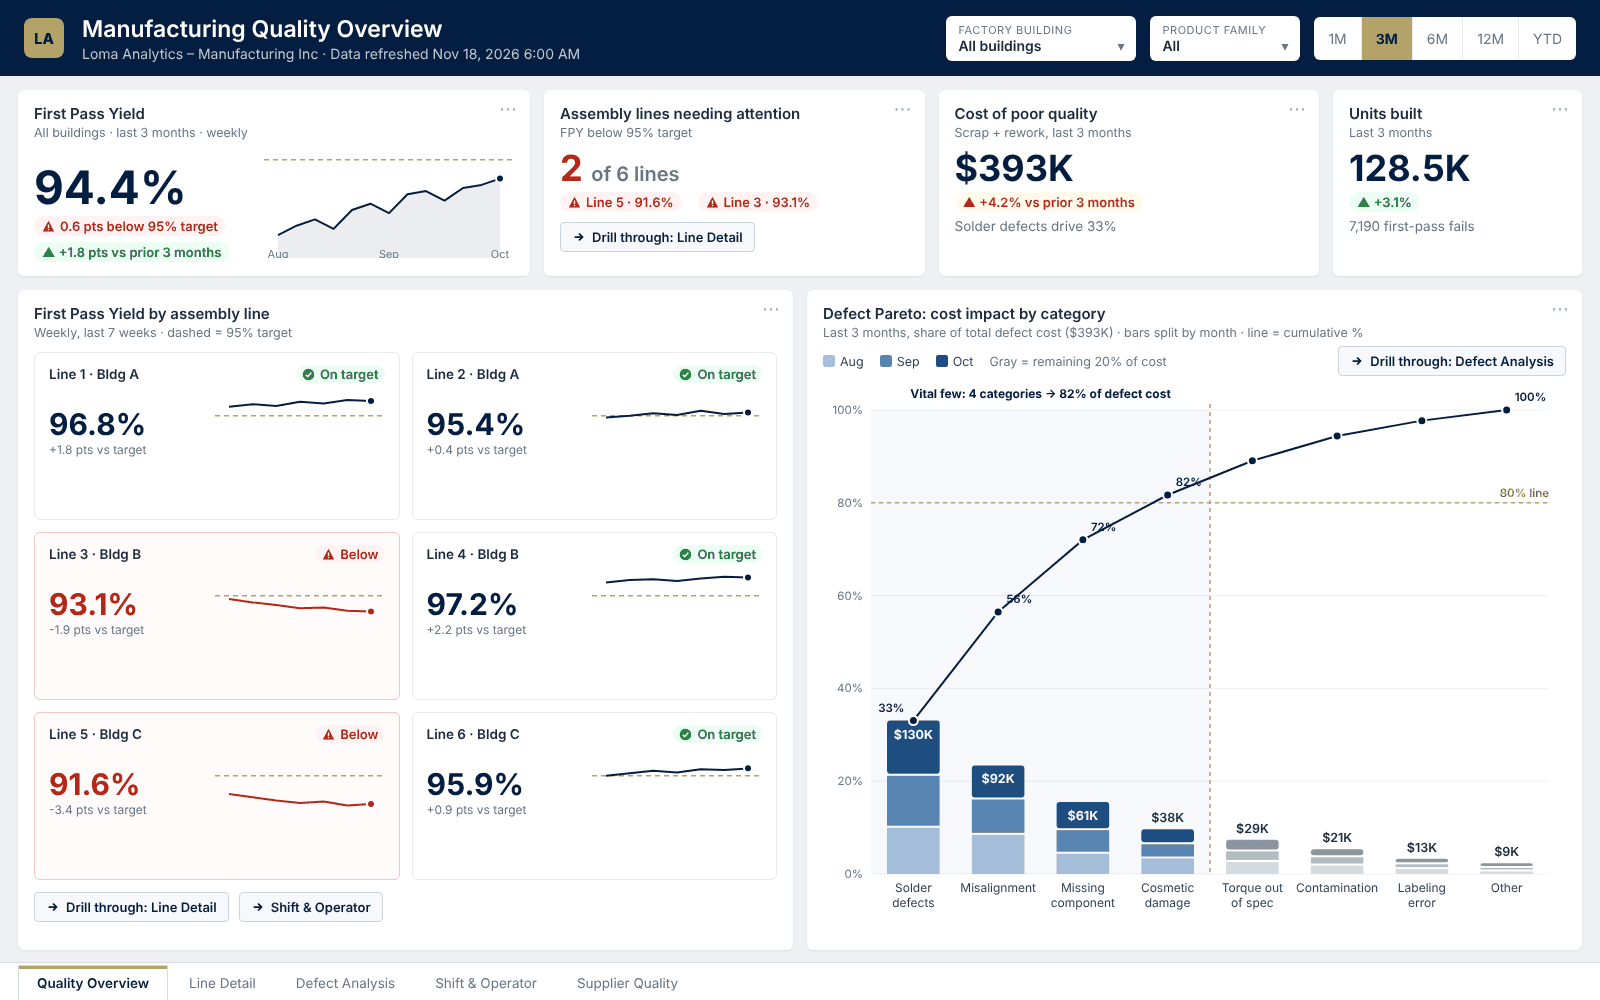 View full size: Manufacturing quality (opens in a new tab)
Manufacturing quality
First pass yield by line, with a cost-weighted defect Pareto that shows where 80% of the cost sits.
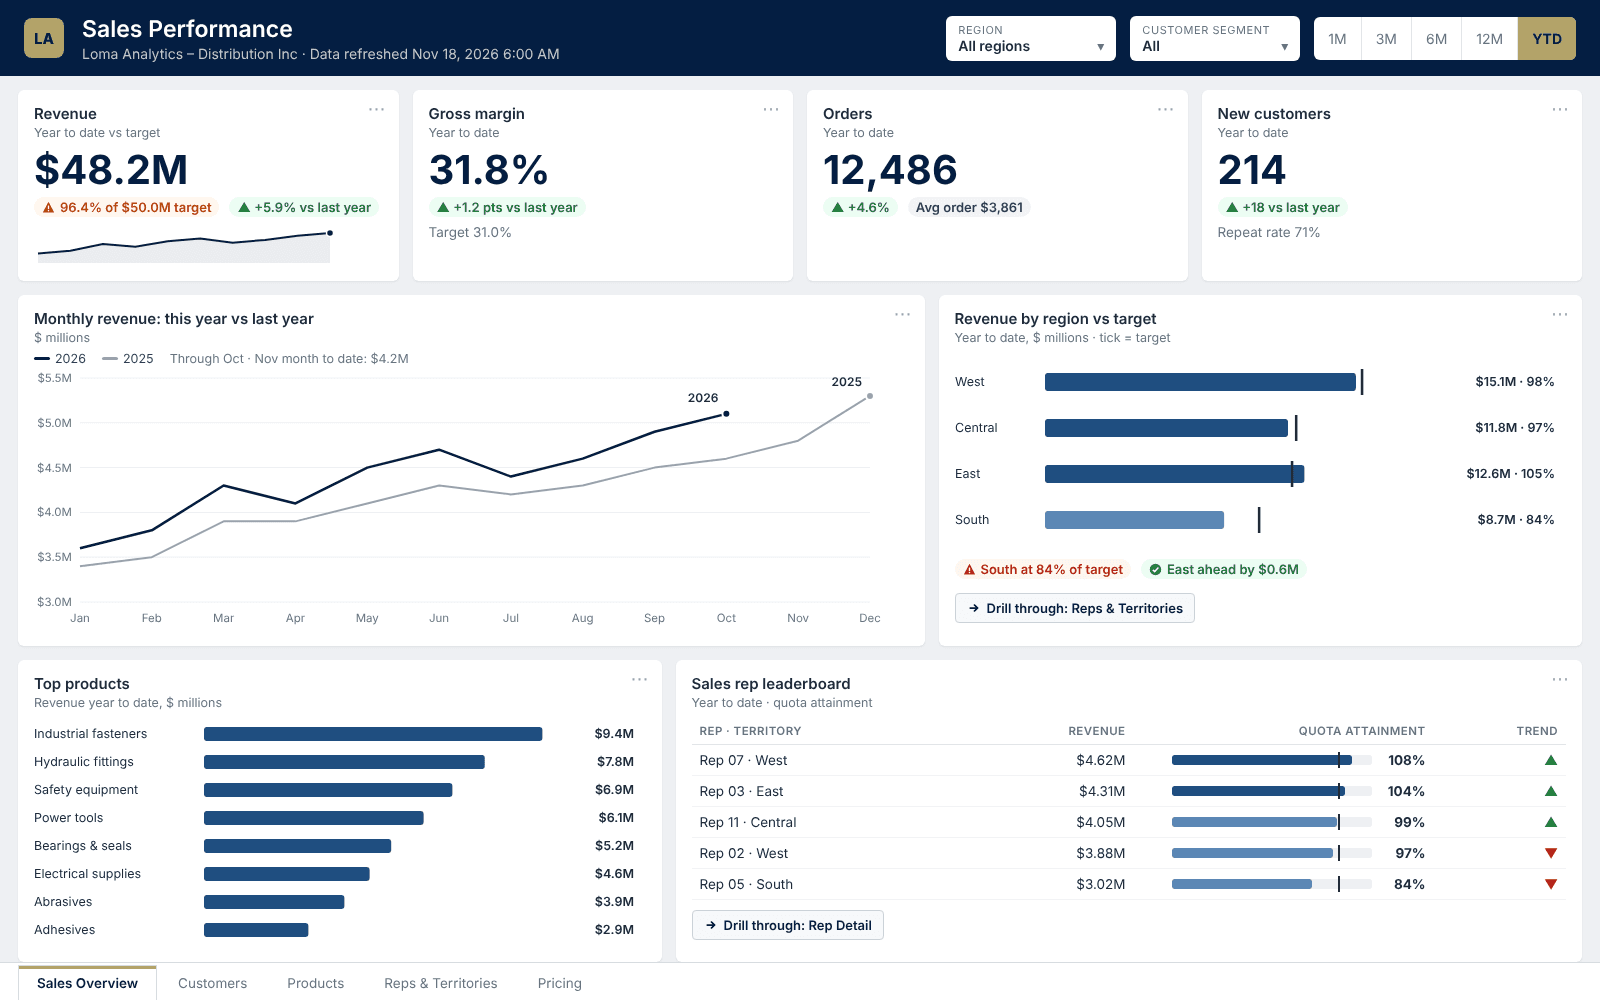 View full size: Sales performance (opens in a new tab)
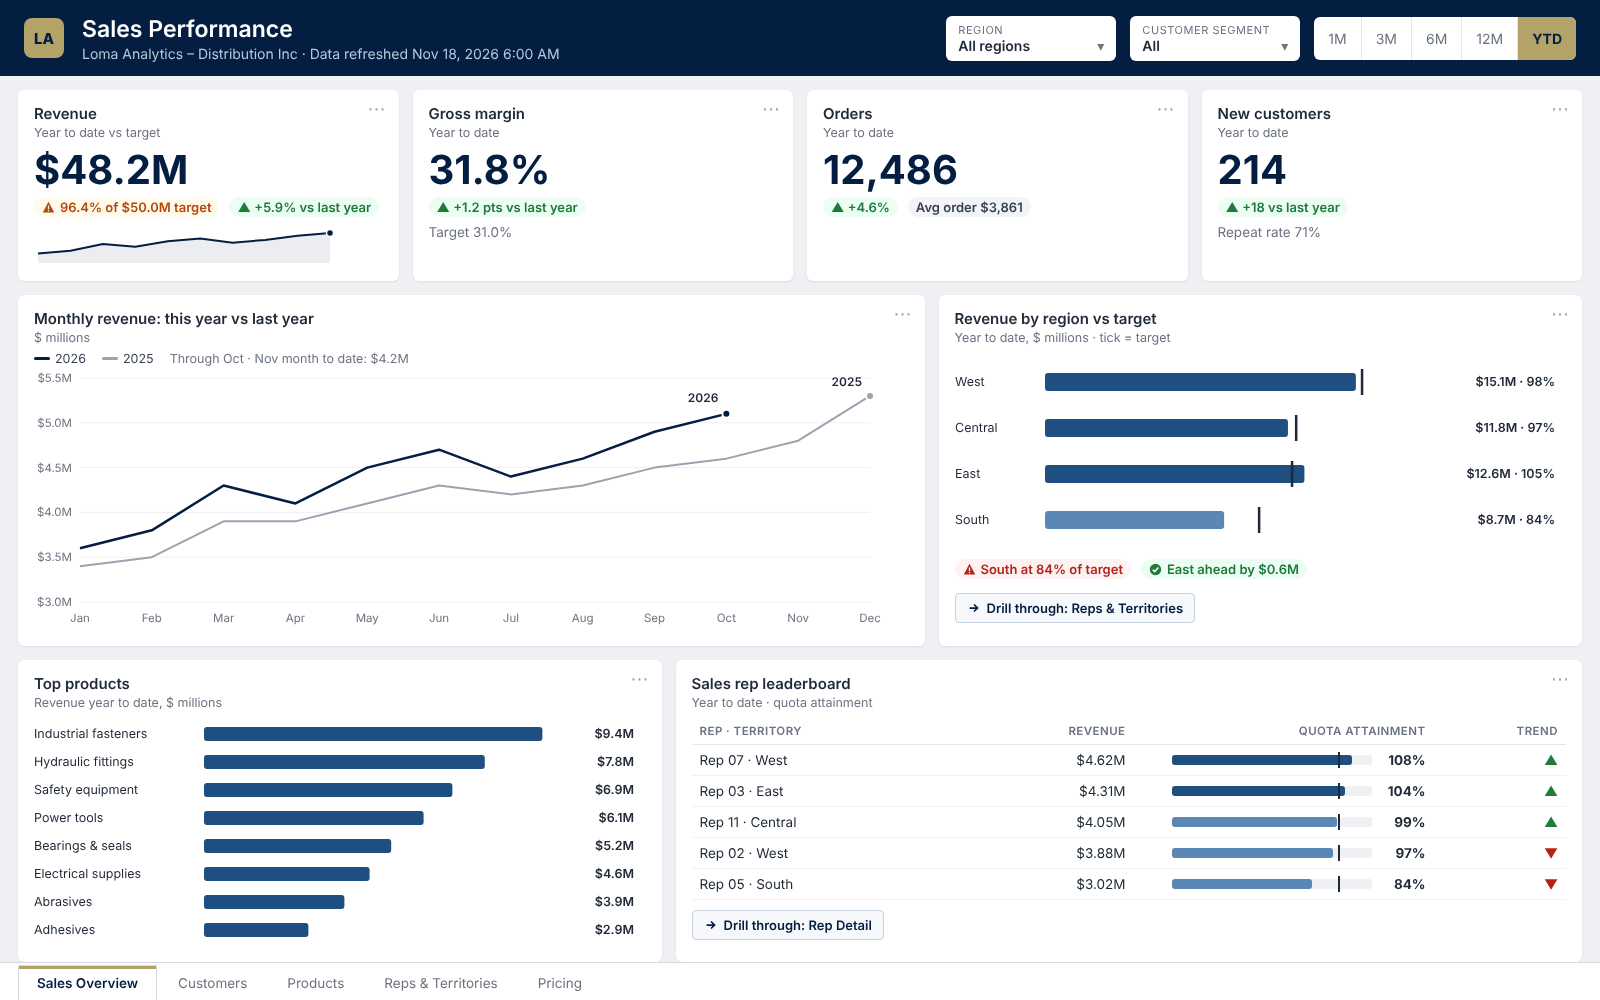
Sales performance
Revenue against target and last year, by region, product and rep.
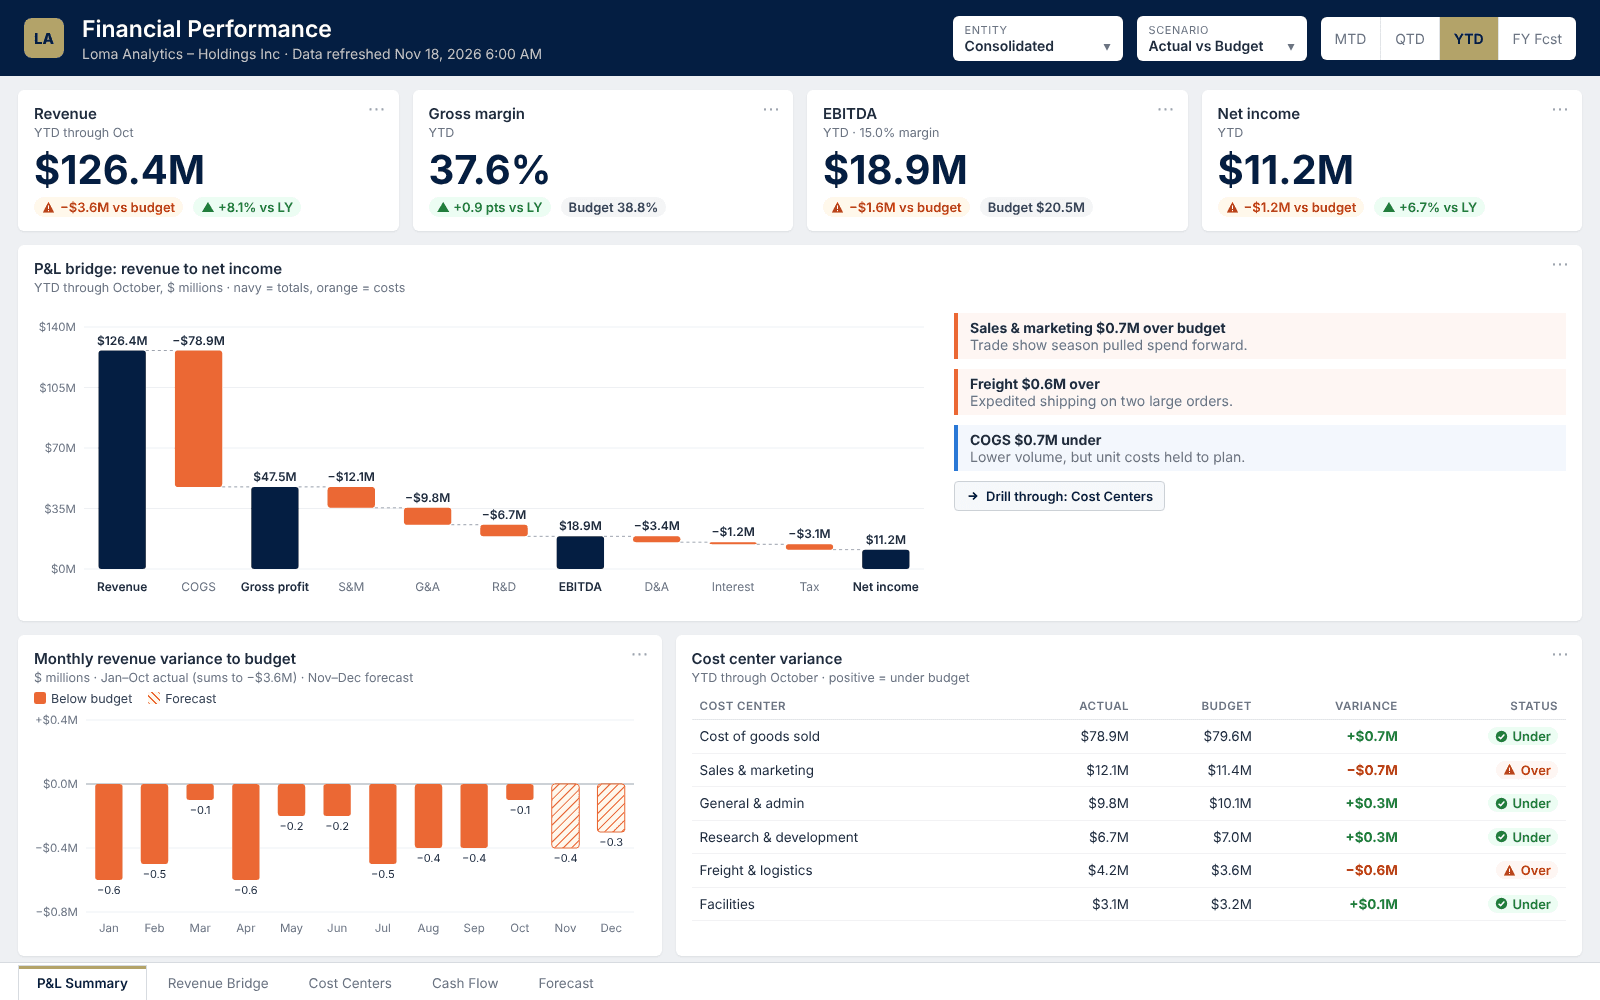 View full size: Financial performance (opens in a new tab)
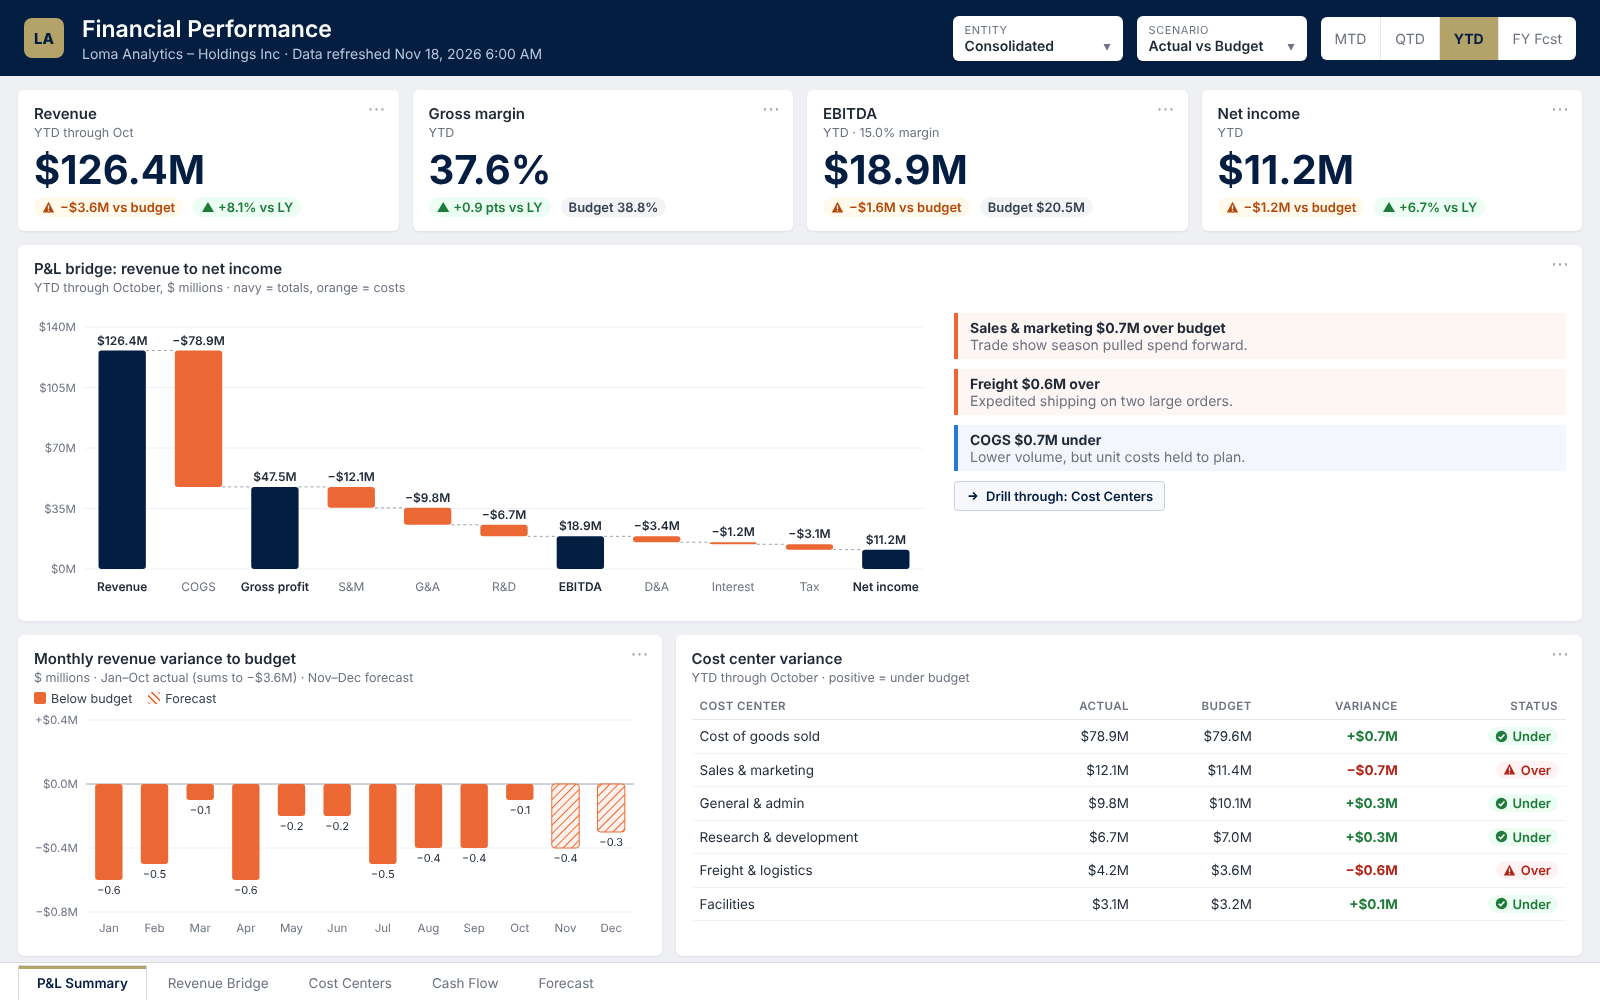
Financial performance
A P&L bridge from revenue to net income, with variance to budget by month and by cost center.
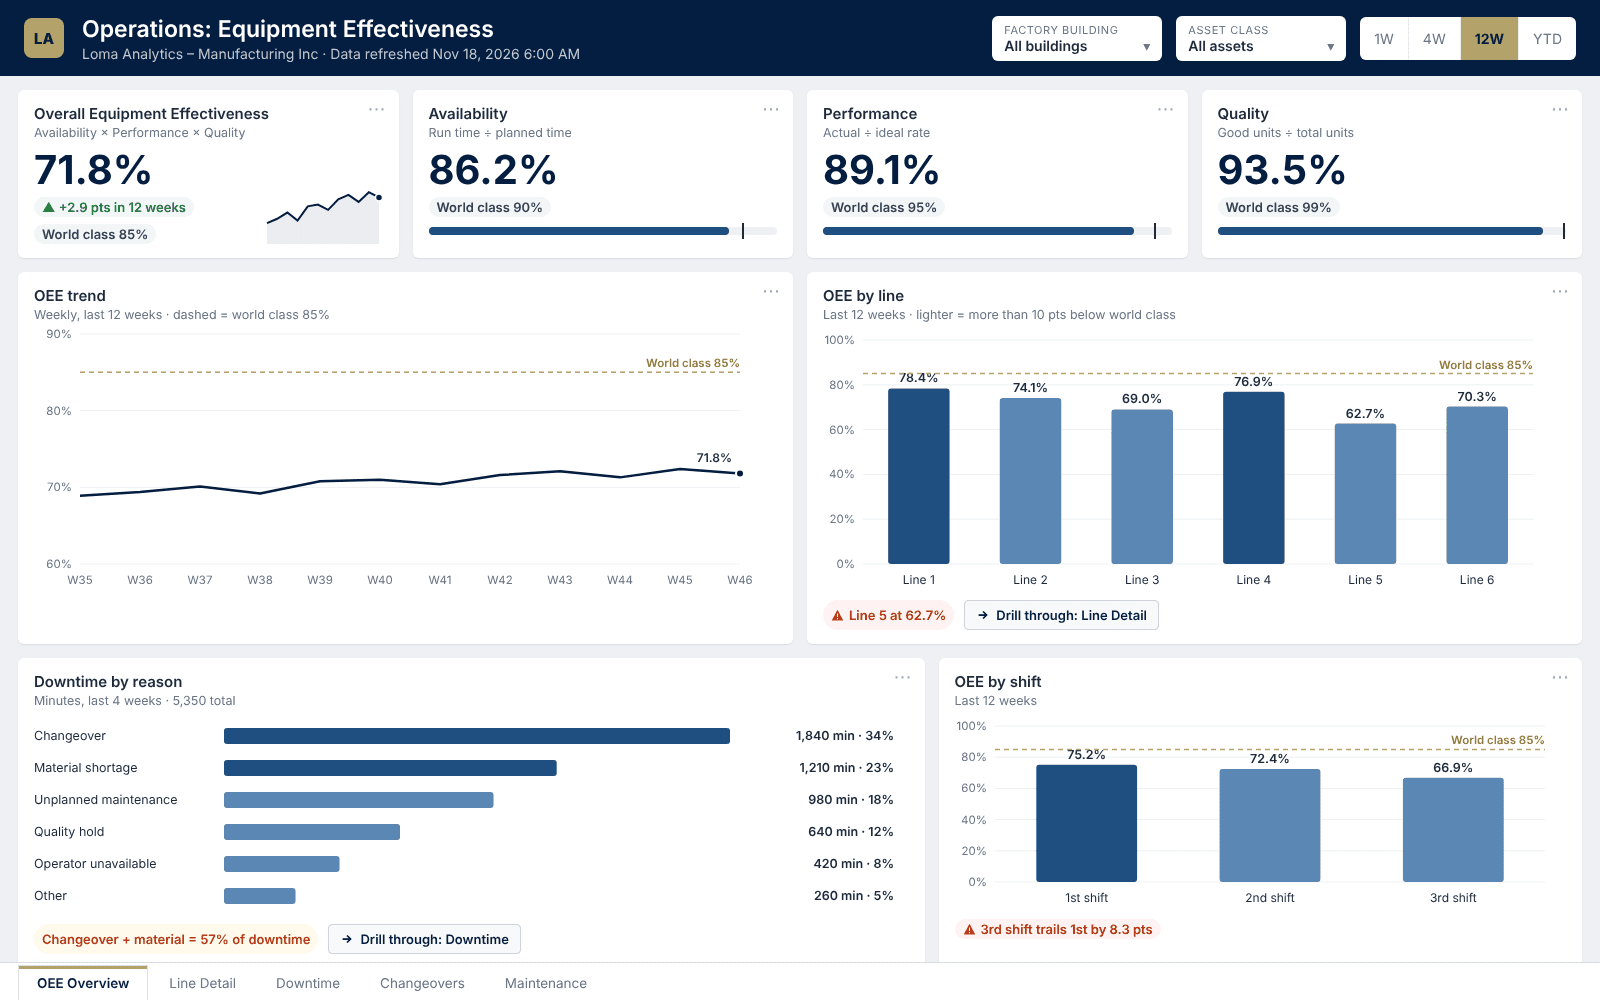 View full size: Equipment effectiveness (opens in a new tab)
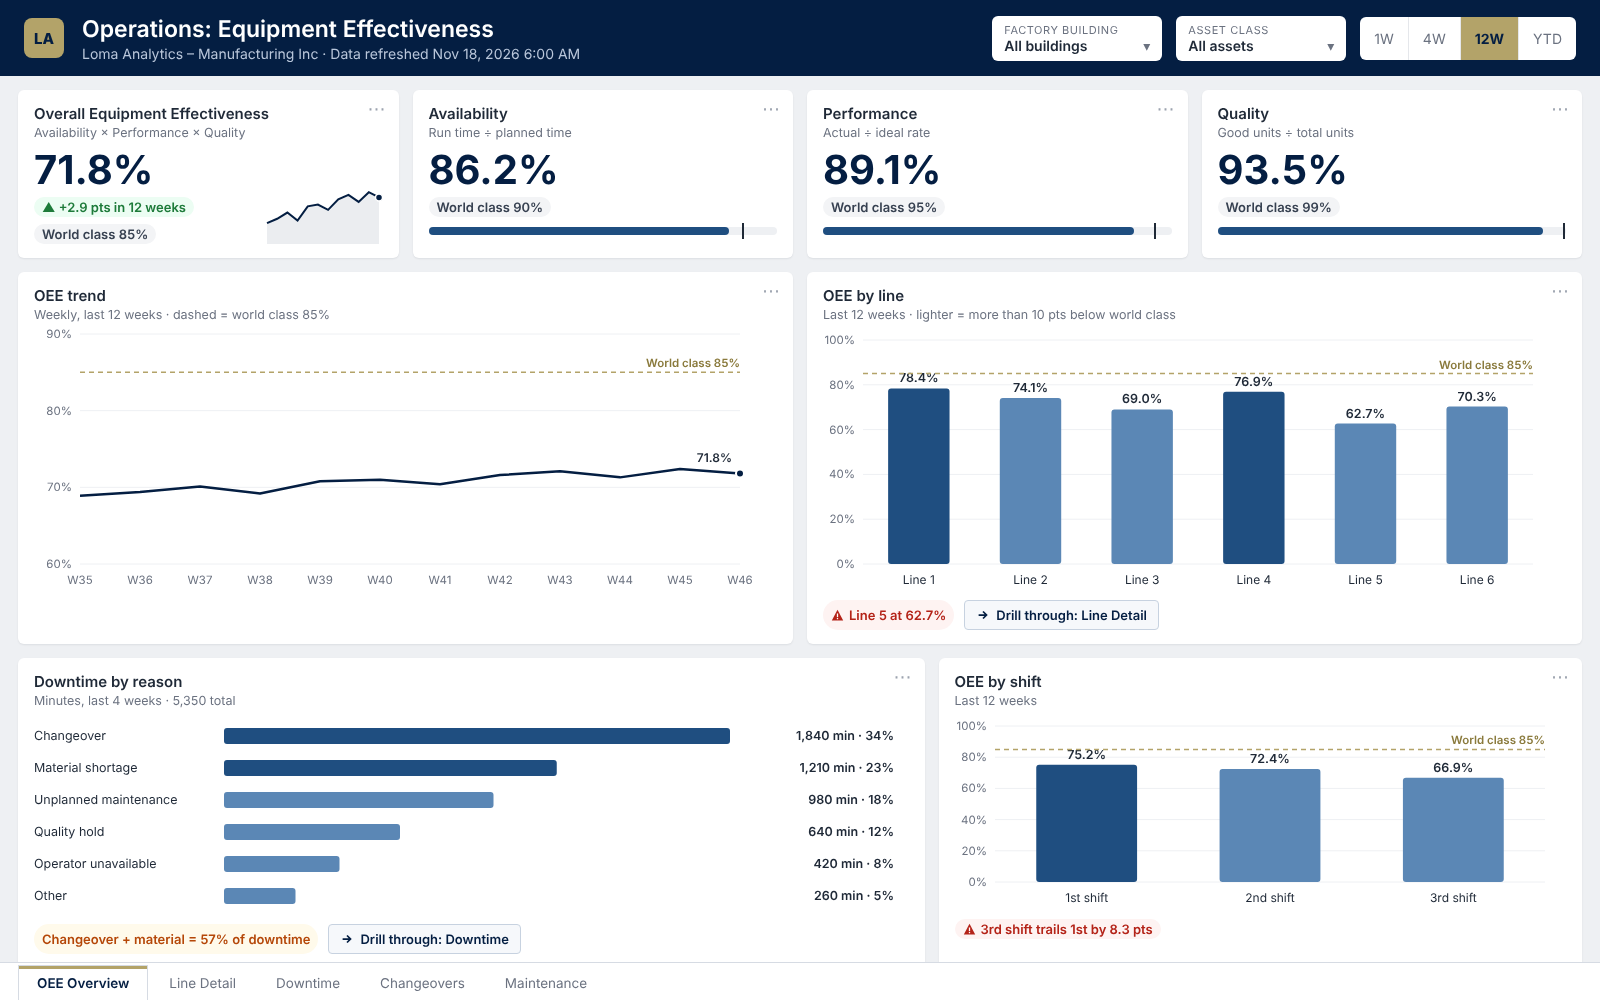
Equipment effectiveness
OEE split into availability, performance and quality, with the downtime reasons behind it.
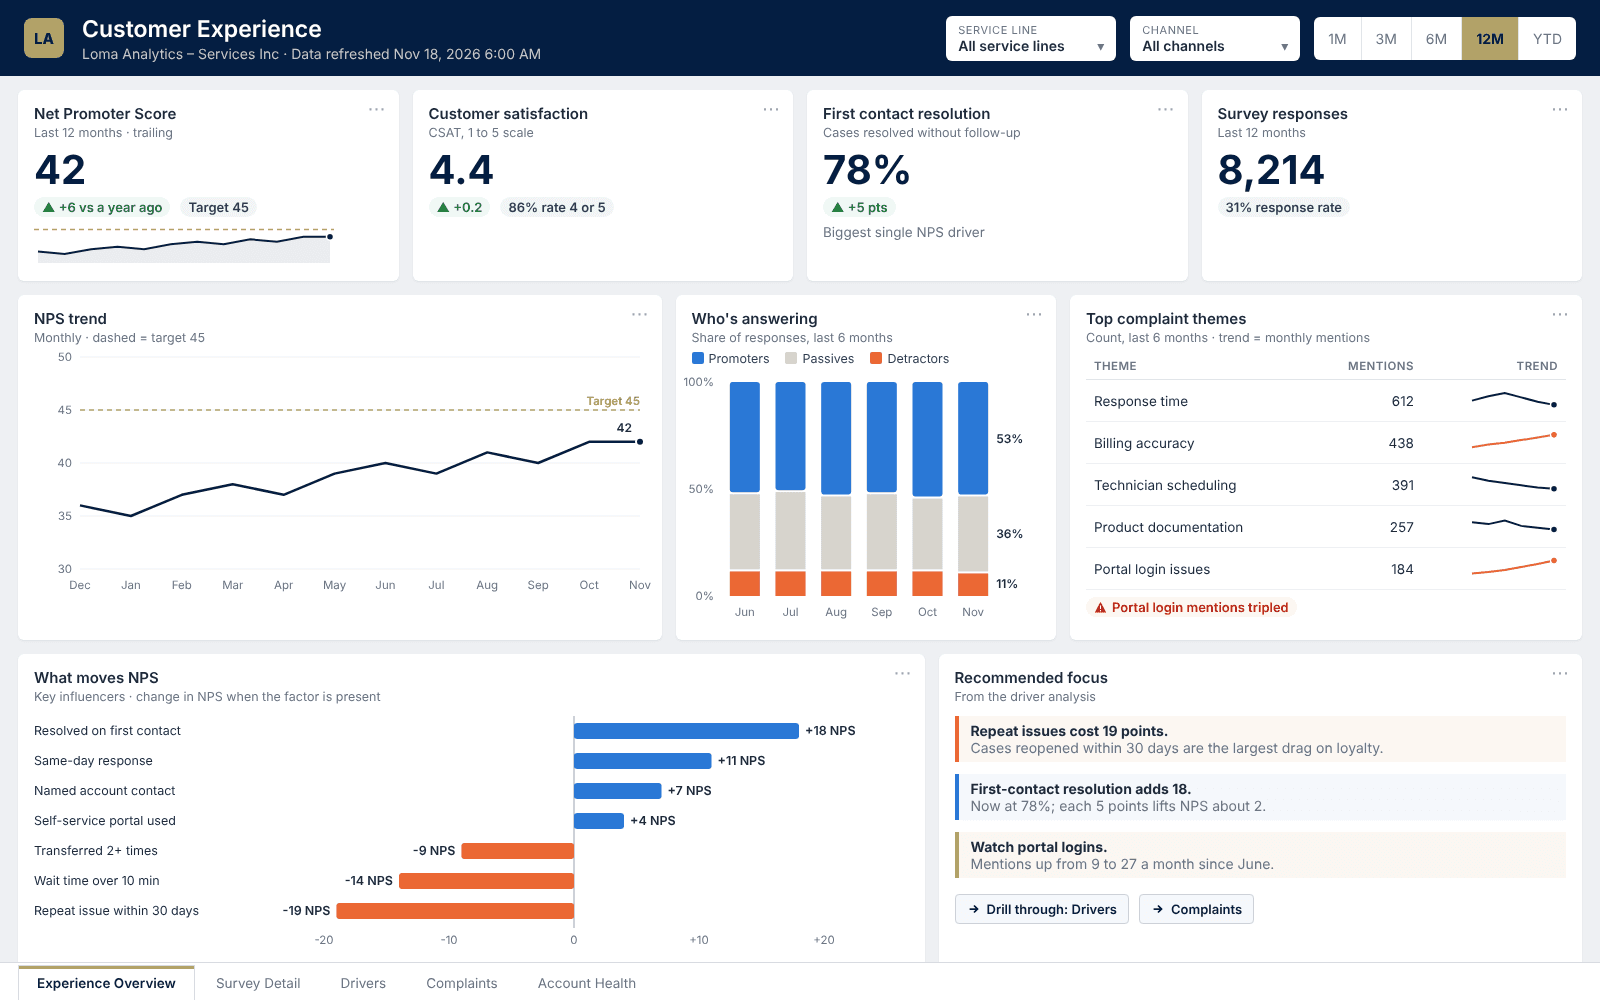 View full size: Customer experience (opens in a new tab)
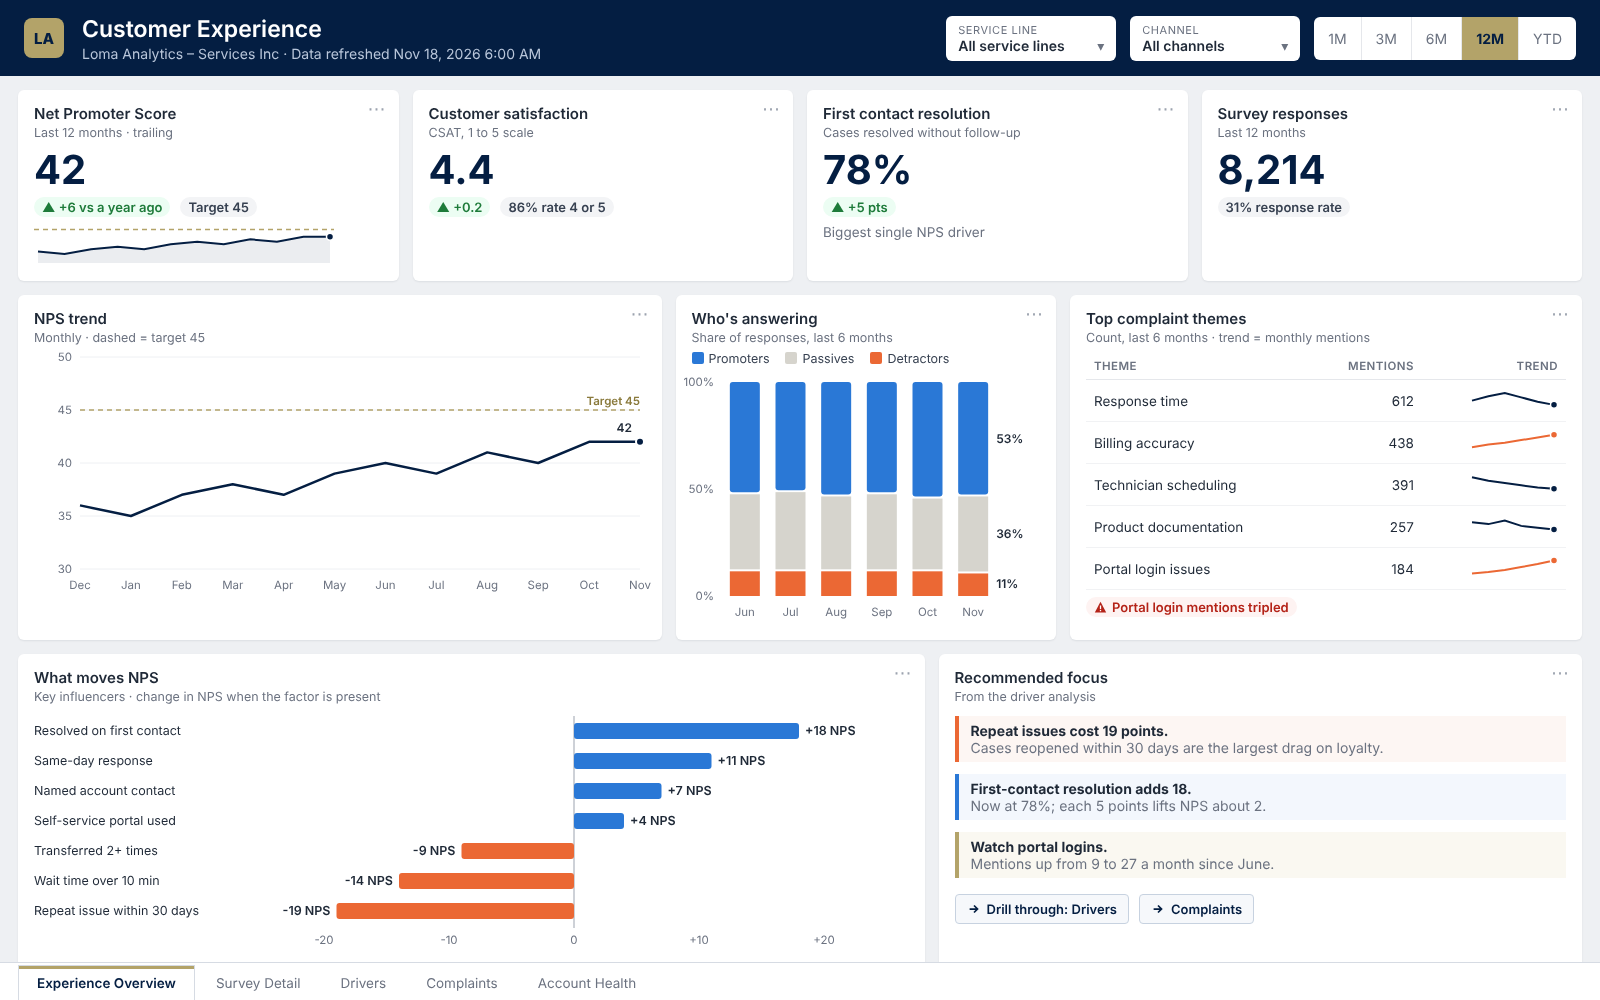
Customer experience
NPS and the factors that move it, so improvement work starts in the right place.
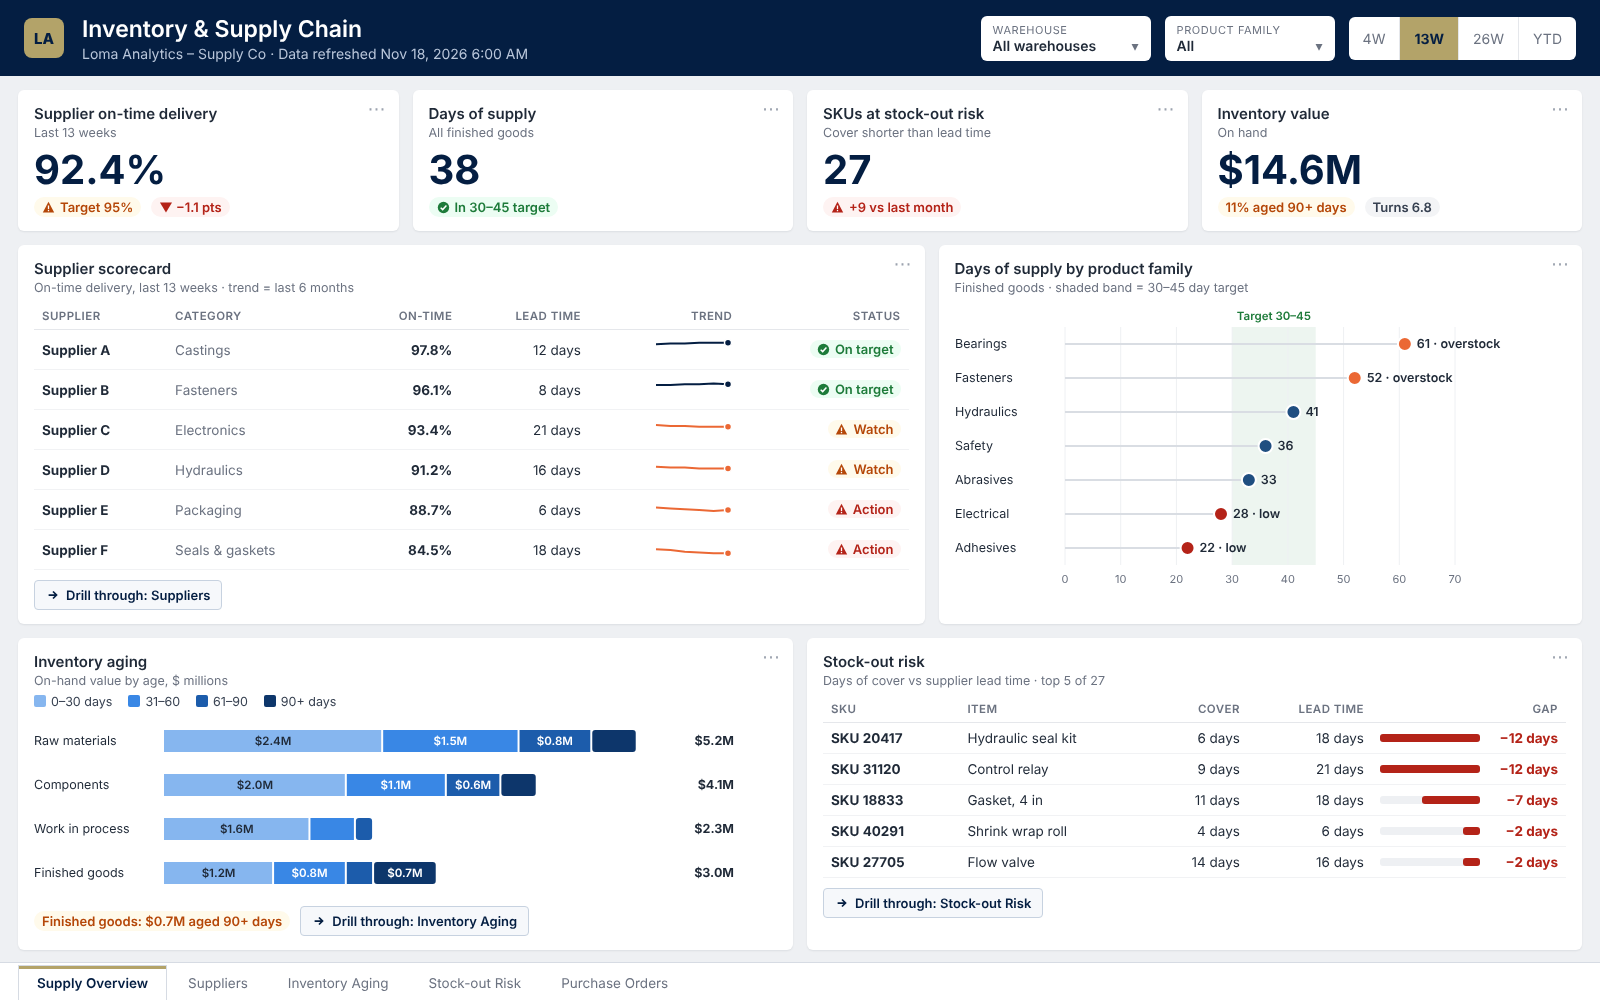
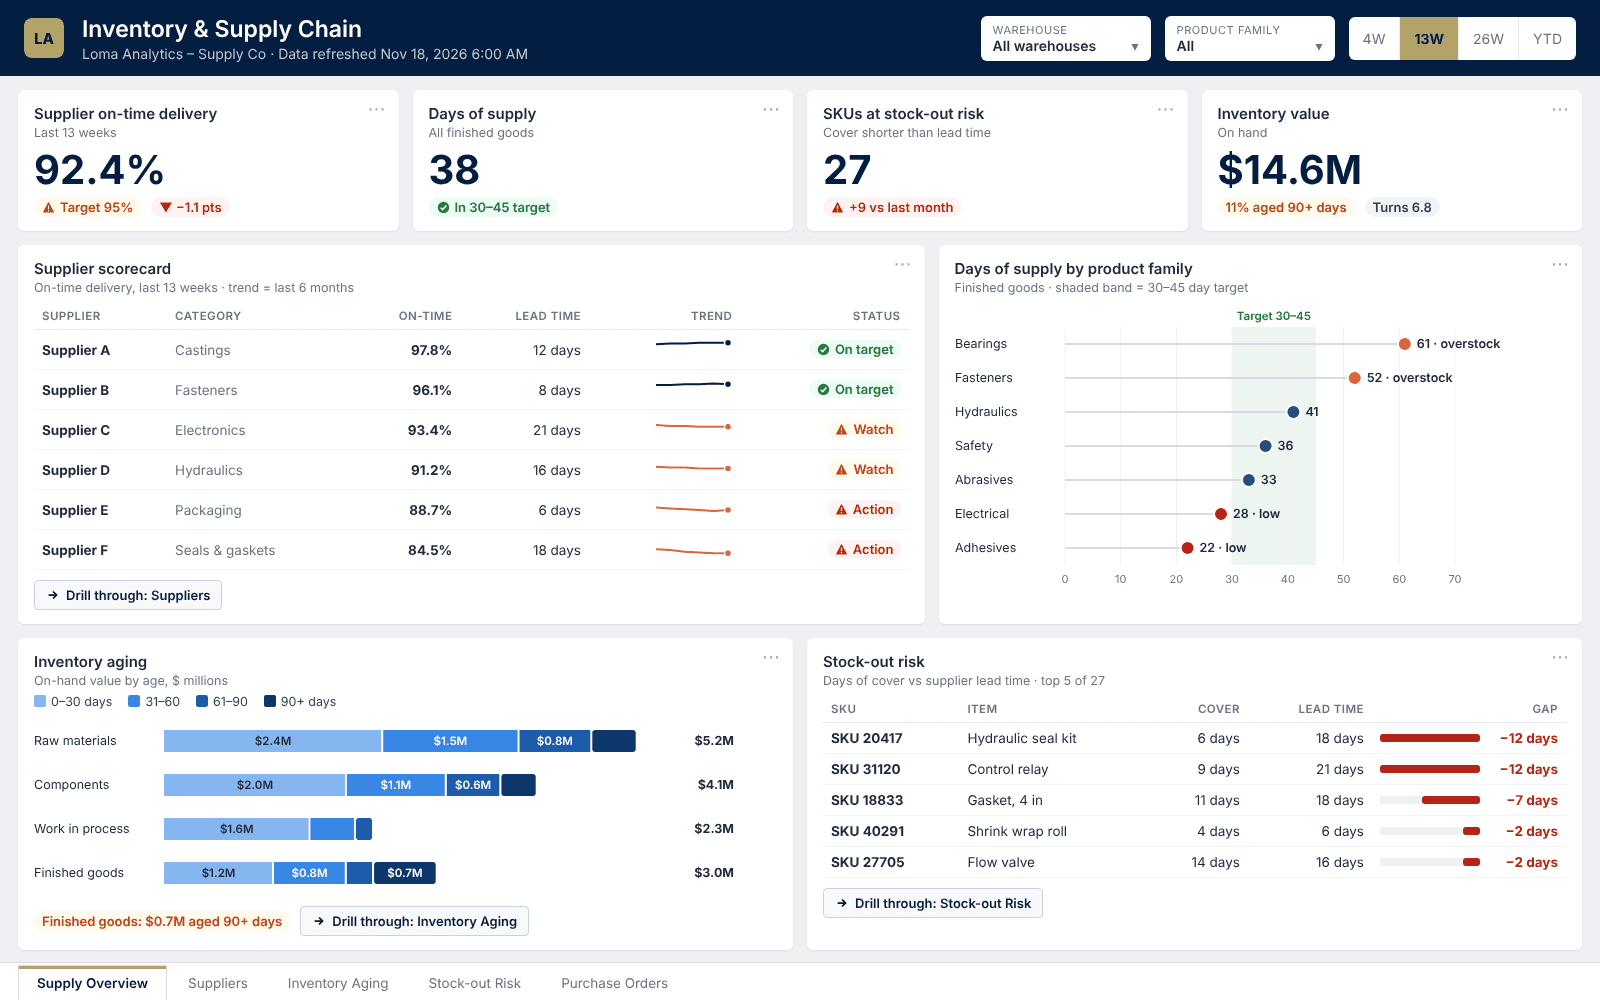 View full size: Inventory & supply chain (opens in a new tab)
Inventory & supply chain
Supplier on-time delivery, days of supply against target, inventory aging and stock-out risk.
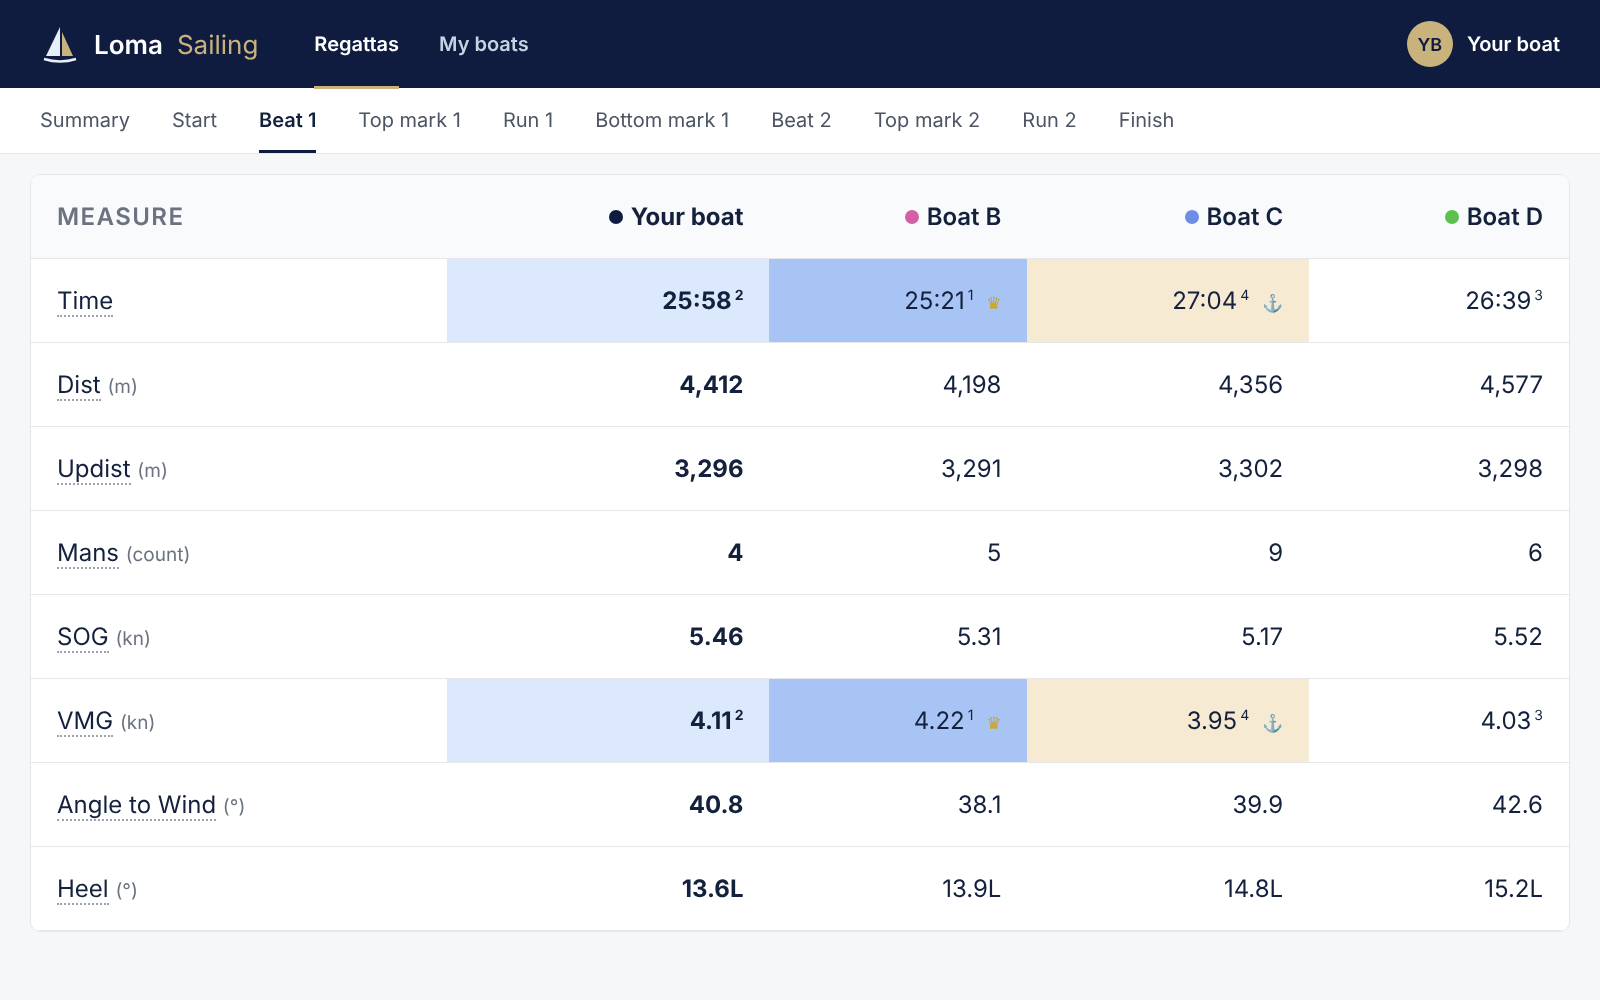
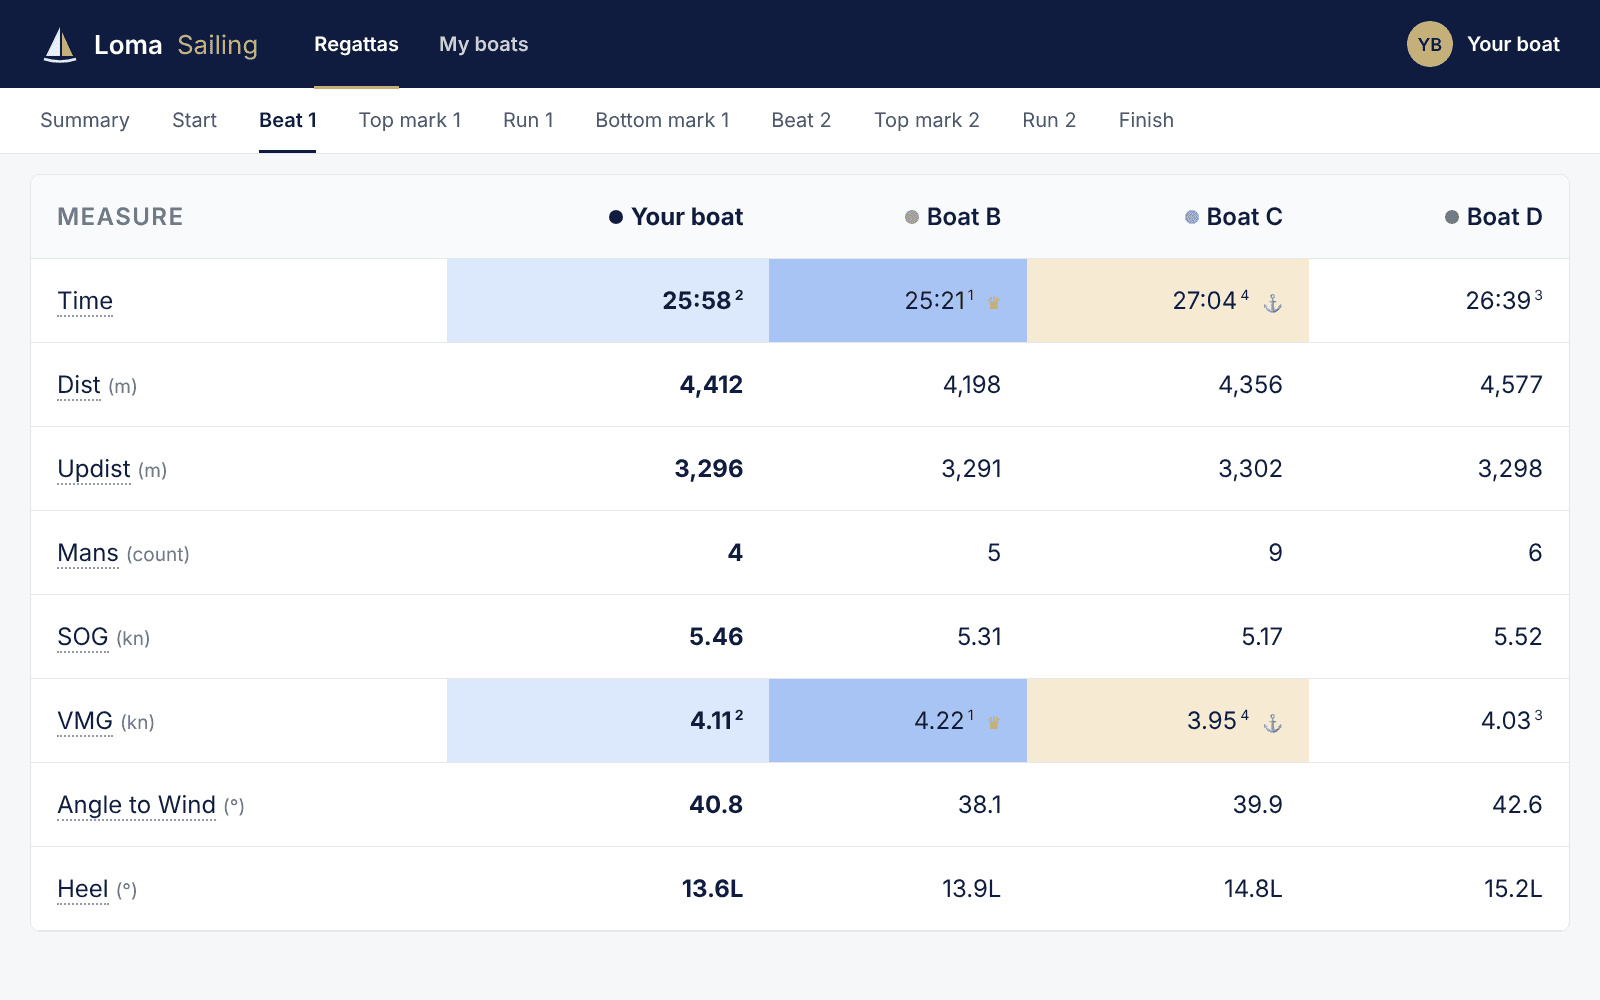 View full size: Our own product: Loma Sailing (opens in a new tab)
Our own product: Loma Sailing
Race analytics built the same way: one model, every leg compared boat by boat.
Under the hood
The semantic model
Every dashboard above sits on a semantic model like this one. Facts for the business events, dimensions for the context, and one set of measures every report shares. That's what keeps the numbers consistent from one report to the next.
How we approach semantic modeling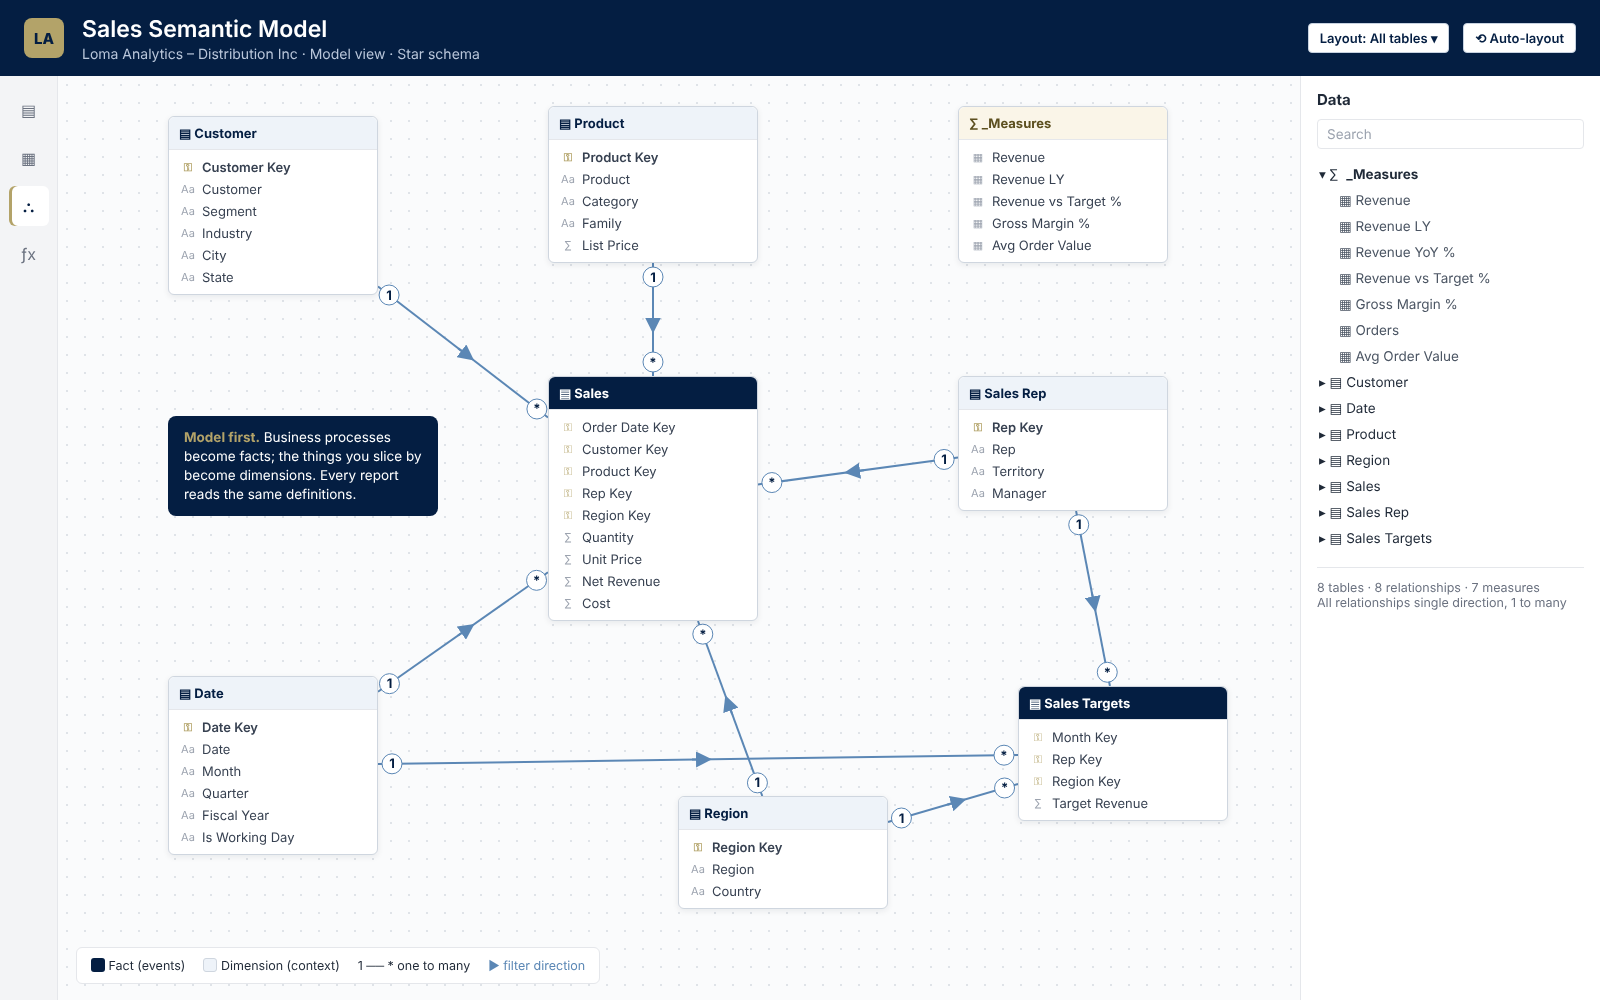 View full size: The semantic model (opens in a new tab)
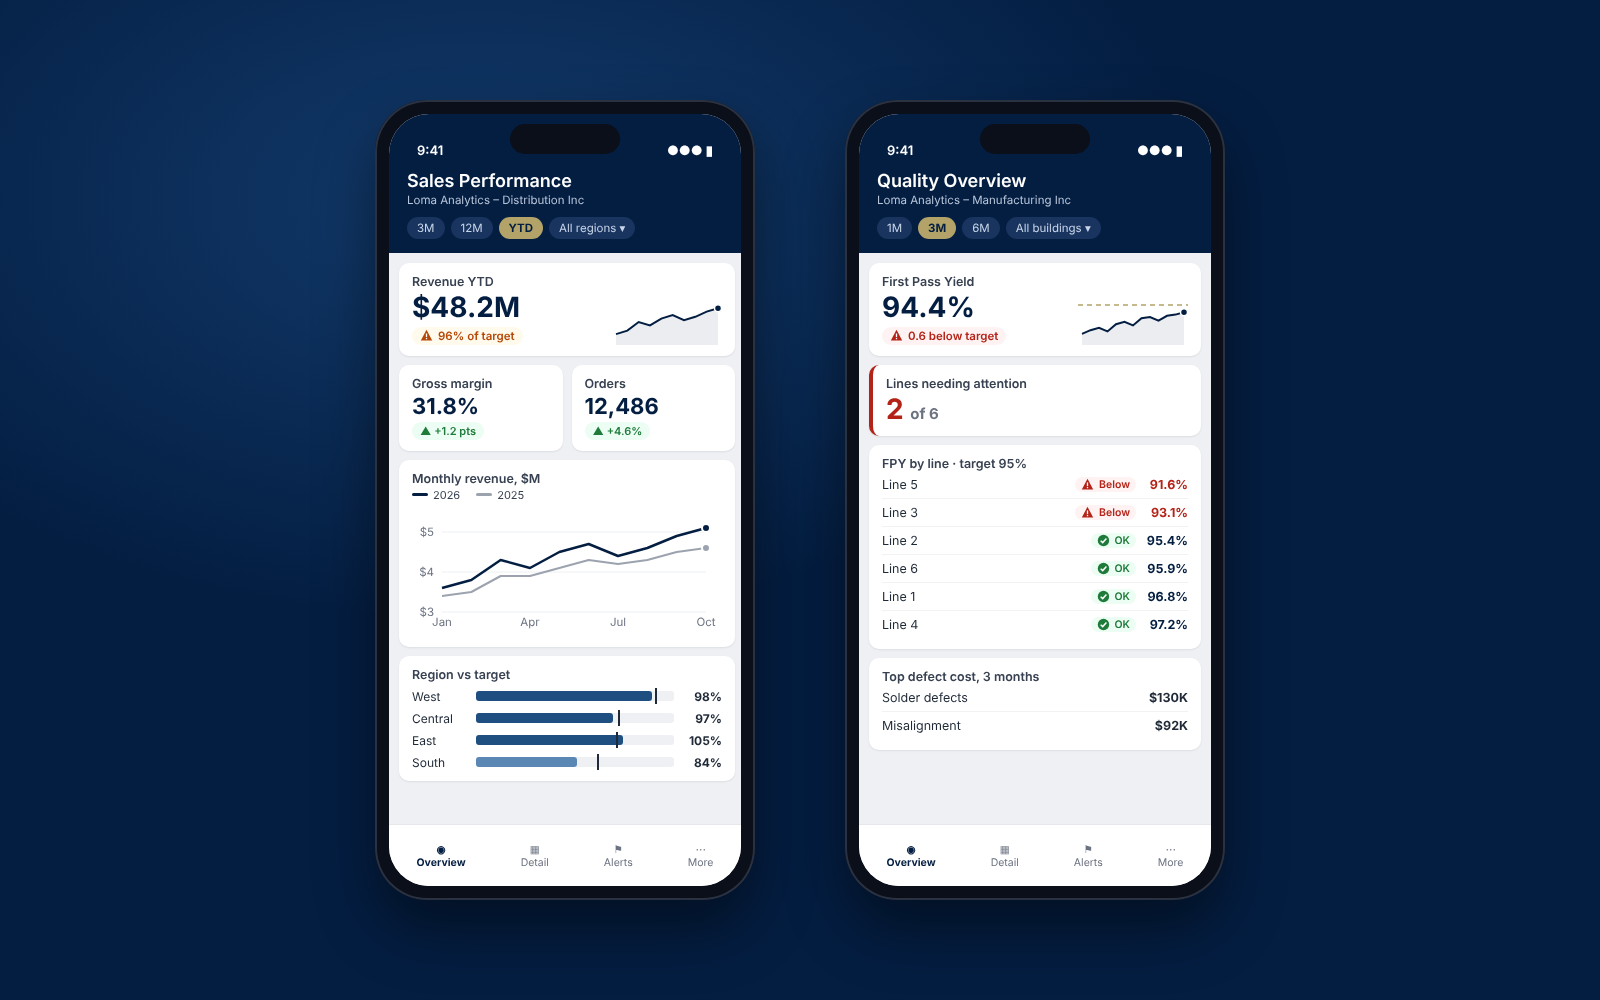 View full size: Reports that travel (opens in a new tab)
On the phone
Reports that travel
The same model, laid out for phones. Phone layouts are designed for the few numbers people check on the move, not shrunk from the desktop page.
Want reporting like this on your own data?
It starts with the model. Check how ready yours is, or see the ways we can work together.